Export Emissions Methodology
27 August 2019 | Data Methodology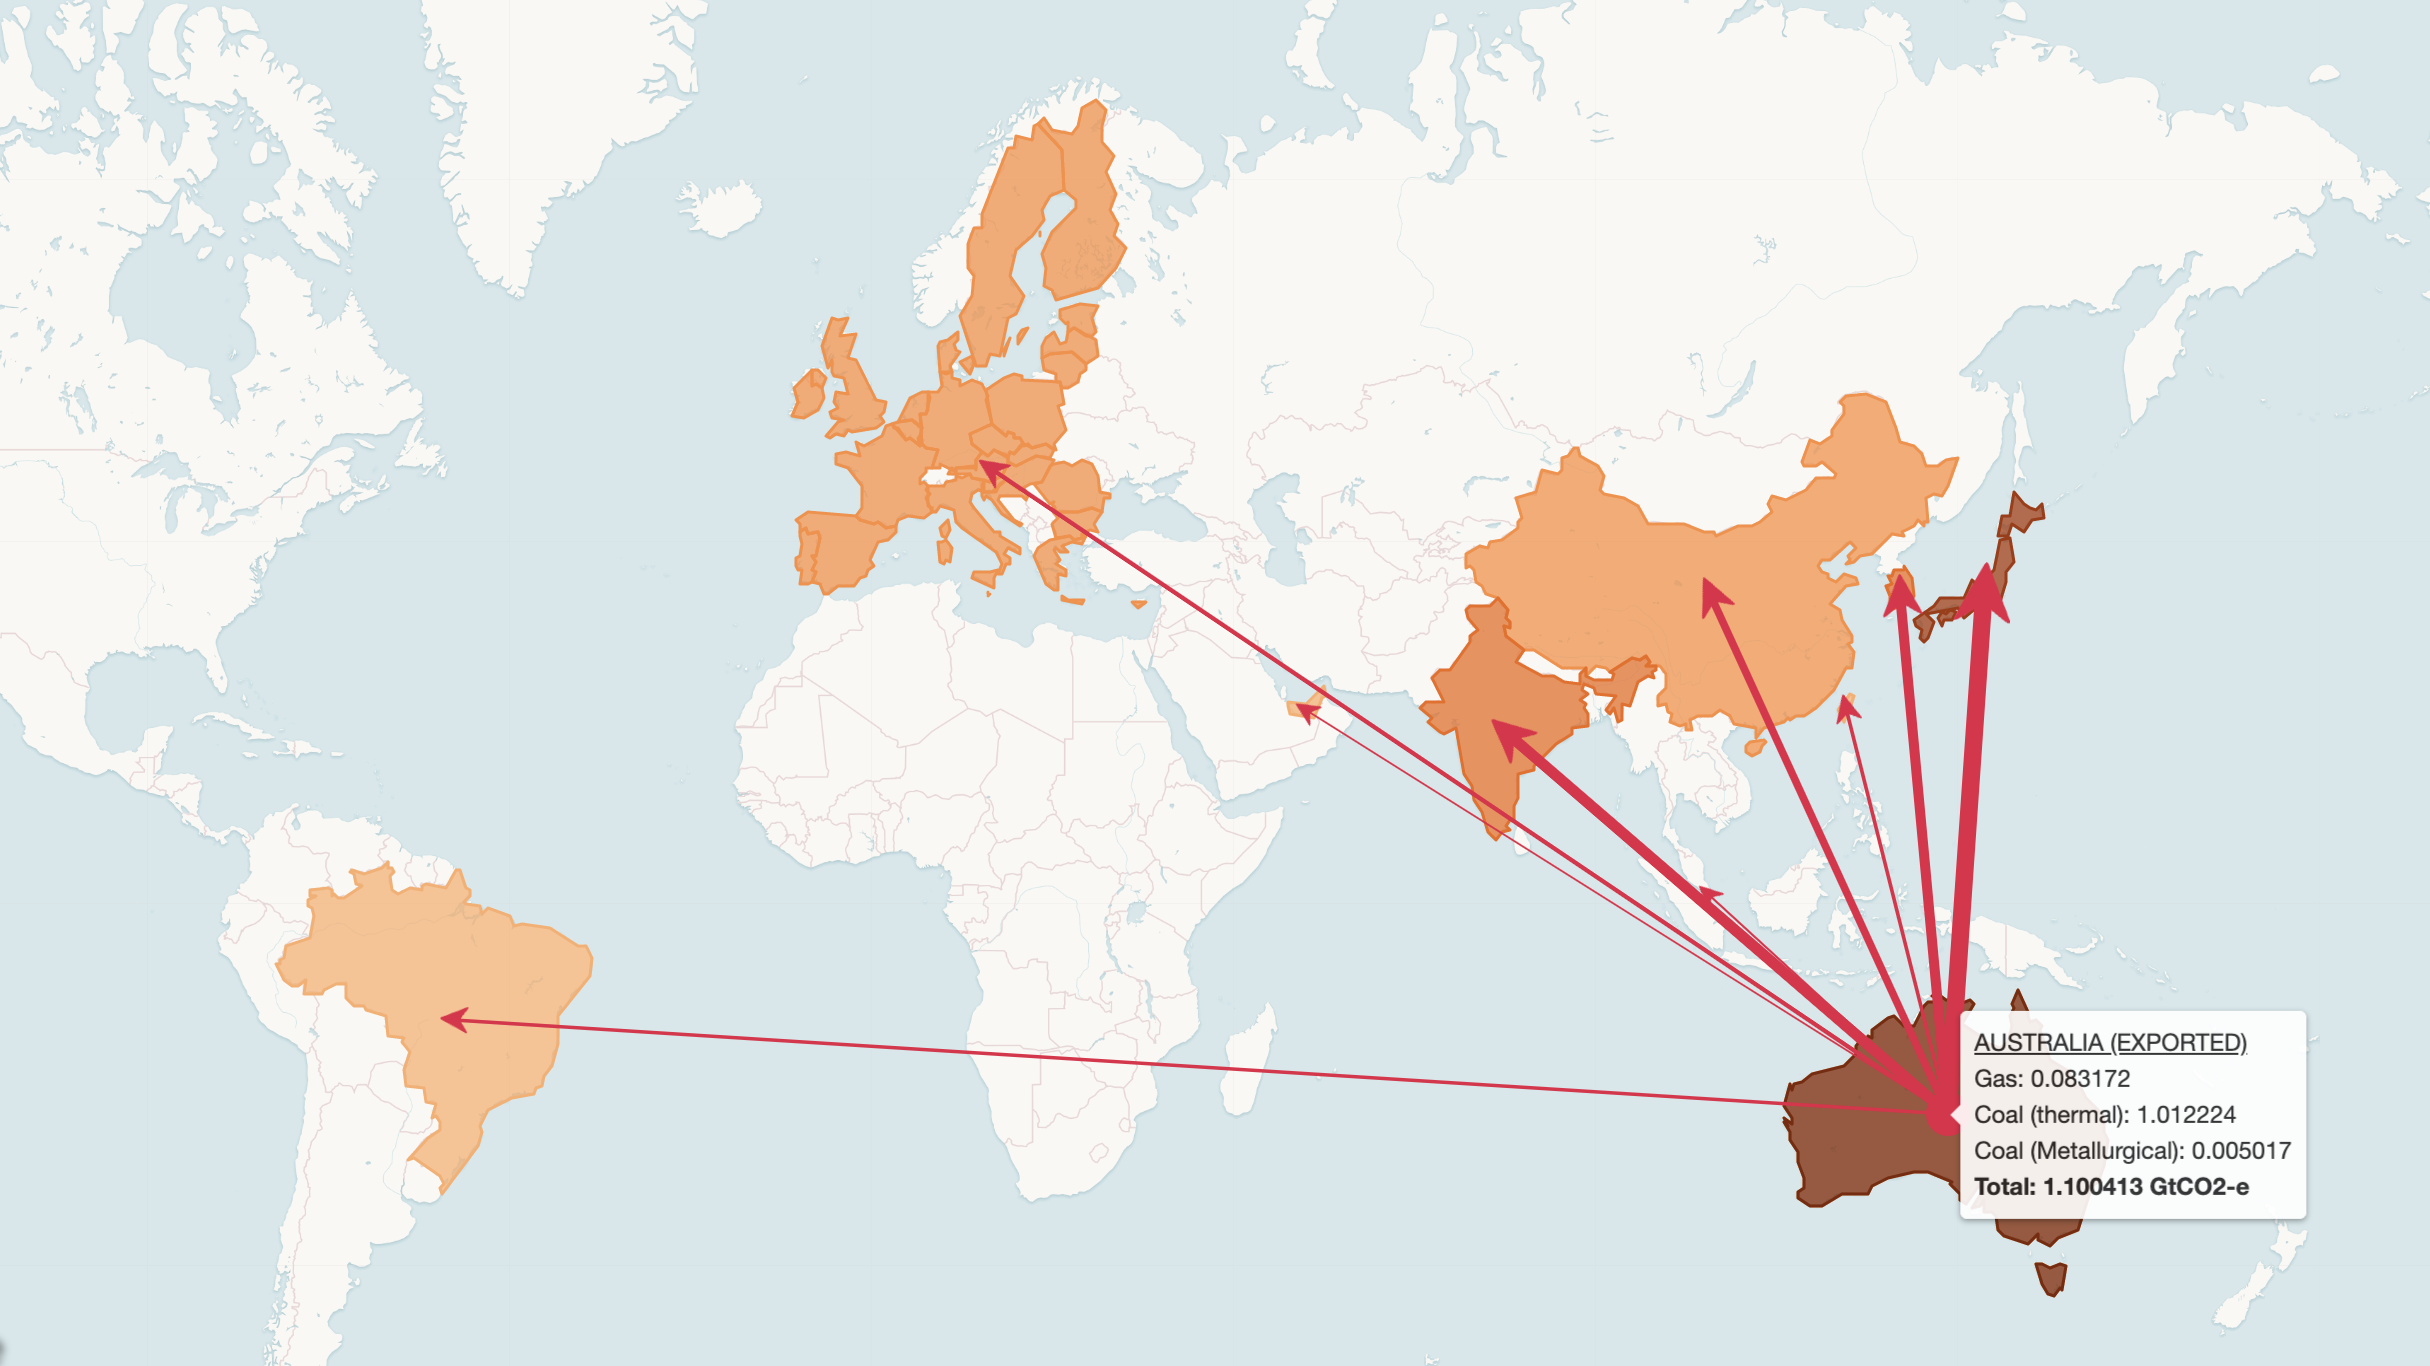
Methodology for the export emissions
Sources
The Australian fossil fuel export data come from the Department of Environment and Energy1 (DEE), the Office of the Chief Economist2 (OCE) and the International Energy Association3 (IEA). The DEE publishes data for each financial year on the total export of all Australian coal, gas, liquid natural gas and oil. The DEE also provides the total Australian export of hard, black, coking and thermal coal. The OCE publishes quarterly data for the total export and destinations of Australian hard, thermal and coking coal. The IEA publishes the total export and destinations of all Australian gas, and liquid natural gas.
The Canadian, Norwegian and United States fossil fuel export data come from the International Energy Association3,4,5 (IEA). The IEA publishes the total export and destinations of all gas3, coal4, oil5 and liquid natural gas5.
Calculation of fossil fuel export emissions
Data from various sources is either displayed directly or is used to calculate the emissions associated with the combustion of the fossil fuel. The standard physical units are Million tonnes (Mt), the standard energy units are Petajoules (PJ) and standard emission units are GtCO2-e (Gt of CO2 equivalent emission). Depending on the unit used in the fossil fuel data, the emission factor and a calorific value from the IPCC (2006) guidelines for national greenhouse gas inventories6 are used to calculate the emissions. The Australian DEE data are first converted from financial years (from July to June) into calendar years by estimating that the data for a given calendar year is equivalent to the data of the financial year starting on July of that year.
References
1Department of Environment and Energy (2018). Australian Energy Statistics (Table J and Table N).
https://www.energy.gov.au/publications/australian-energy-update-2018
2 Office of the Chief Economist (2019). Quaterly – Historical Data June 2019.
https://publications.industry.gov.au/publications/resourcesandenergyquarterlyjune2019/index.html
3 International Energy Association (2018). Natural gas imports by origin, doi: 10.1787/naturgas-data-en
https://www.oecd-ilibrary.org/energy/data/iea-natural-gas-information-statistics_naturgas-data-en
4 International Energy Association (2018). Coal imports by origin, doi: 10.1787/coal-data-en
5 International Energy Association (2018). World oil statistics, doi: 10.1787/oil-data-en
6 Garg, Amit, K. Kazunari, T. Pulles (2006). IPCC Chapter 1 Introduction: Guidelines for National Greenhouse Gas Inventories, Tables 1.2 and 1.4.
https://www.ipcc-nggip.iges.or.jp/public/2006gl/pdf/2_Volume2/V2_1_Ch1_Introduction.pdf
Methodology for the carbon major
Calculation of fossil fuel export emissions
Data from various sources is used to calculate the emissions associated with the combustion of the fossil fuel. The source data for oil, liquid natural gas and natural gas is commonly given in imperial units, which are converted to standard units using conversion factors to Million British thermal units (MBtu)1, which in turn is converted to Megajoules (MJ)2. This implies an approximation where the heat content within a barrel of oil equivalent is assumed constant. The conversion factor for 2018 is used, whilst the conversions given by the U.S. Energy Information Administration for the heat content per barrel vary through years by 1-2%. Likewise, the heat content in cubic feet of natural gas is estimated using the marketed rate for 2018 and is assumed constant through the years, whilst the conversion factors change by 1-5%.
The source data for coal is converted from Mt into energy units (Terajoules, TJ) using the calorific value3 as specified by the IPCC (2006) guidelines for national greenhouse gas inventories. The carbon data are separated into two main categories, thermal and metallurgical coal. When the type of coal is ambiguous (e.g. semi-soft coal or the weight given as a whole for coal), the total is converted using the highest energy content to assume the lowest emission per Mt of coal.
The standard energy units are then converted into Gt of CO2 equivalent emission (GtCO2-e). The emission factor3 as specified by the IPCC (2006) guidelines for national greenhouse gas inventories are used to calculate the emissions.
References
1 U.S. Energy Information Administration: Monthly Energy Review, July 2019, Appendix A, Table A1 and A4.
https://www.eia.gov/totalenergy/data/monthly/archive/00351907.pdf
2 U.S. Energy Information Administration: Monthly Energy Review, July 2019, Appendix B, Table B1.
https://www.eia.gov/totalenergy/data/monthly/archive/00351907.pdf
3 Garg, Amit, K. Kazunari, T. Pulles (2006). IPCC Chapter 1 Introduction: Guidelines for National Greenhouse Gas Inventories, Tables 1.2 and 1.4.
https://www.ipcc-nggip.iges.or.jp/public/2006gl/pdf/2_Volume2/V2_1_Ch1_Introduction.pdf
Exports
Table 1. List of Australian export data with their sources, units and type of conversion applied from the source to the database.
| Data type | Data Sub-type | Division | Units | Source | Source acronym | Operation |
|---|---|---|---|---|---|---|
| Coal | All | Total for Australia only | kt | Department of the Environment and Energy (2018), Australian Energy Statistics, Table N | DEE | Coking Coal + Thermal Coal Conversion from financial year to calendar year |
| Black Coal | Total for Australia only | PJ | Department of the Environment and Energy (2018), Australian Energy Statistics, Table J | DEE | Direct input converted from financial year to calendar year | |
| Coking Coal | Total for Australia only | kt | Department of the Environment and Energy (2018), Australian Energy Statistics, Table N | DEE | Direct input converted from financial year to calendar year | |
| Coking Coal | By country of export | Mt | Department of Industry, Innovation and Science (2019), Office of the Chief Economist, Resources and Energy Quarterly – June 2019 | OCE | Sum the quarterly data for each year and for “high quality” and “other” metallurgical coal | |
| Hard Coal | By country of export | Mt | Department of Industry, Innovation and Science (2019), Office of the Chief Economist, Resources and Energy Quarterly – June 2019 | OCE | Sum the quarterly data for each year and for “high quality”, “other” metallurgical coal and thermal coal | |
| Thermal Coal | Total for Australia only | kt | Department of the Environment and Energy (2018), Australian Energy Statistics, Table N | DEE | Direct input Conversion from financial year to calendar year | |
| Thermal Coal | By country of export | Mt | Department of Industry, Innovation and Science (2019), Office of the Chief Economist, Resources and Energy Quarterly – June 2019 | OCE | Sum the quarterly data for each year for thermal coal | |
| Gas | All Gas | By country of export | Mcm | Organisation for Economic Cooperation and Development IEA Natural Gas Information Statistics, Natural gas imports by origin (2018) | OECD Gas | Direct input: Imports by origin, Natural gas (Million cubic metres) |
| All Gas | Total for Australia only | PJ | Department of the Environment and Energy (2018), Australian Energy Statistics, Table J | DEE | Direct input converted from financial year to calendar year | |
| All Gas | By country of export | TJ | Organisation for Economic Co-operation and Development IEA Natural Gas Information Statis-tics, Natural gas imports by origin (2018) | OECD Gas | Direct input: Imports by origin, Natural gas (Terajoules) | |
| Liquid Natural Gas (LNG) | Total for Australia only | kt | Department of the Environment and Energy (2018), Australian Energy Statistics, Table N | DEE | Direct input: LNG Conversion from financial year to calendar year |
|
| Liquid Natural Gas (LNG) | By country of export | Mcm | Organisation for Economic Co-operation and Development IEA Natural Gas Information Statis-tics, Natural gas imports by origin (2018) | OECD Gas | Direct input: Imports by origin, of which Liquified natural gas (Million cubic metres) | |
| Liquid Natural Gas (LNG) | By country of export | TJ | Organisation for Economic Cooperation and Development IEA Natural Gas Information Statistics, Natural gas imports by origin (2018) | OECD Gas | Direct input: Im-ports by origin, of which Liquified natural gas (Terajoules) | |
| Oil | Oil | Total for Australia only | ML | Department of the Environment and Energy (2018), Australian Energy Statistics, Table N | DEE | Direct input: Crude oil and ORF Conversion from financial year to calendar year |
| Oil | Total for Australia only | PJ | Department of the Environment and Energy (2018), Australian Energy Statistics, Table J | DEE | Direct input: Crude oil and ORF Conversion from financial year to calendar year |
Conversions to emissions
All units are converted to standard units:
Coal: Mt
Oil: ML
Gas: Mcm
Energy: PJ
Emissions: GtCO2-e
When fuel data is available in energy units, those are converted directly to emission using the CO2 emission for combustion factor. If the data is not available in energy units, the volume or weight units are first converted using the net calorific value. The equivalence in CO2 emissions are calculated as follow:
Table. 2 Summary of the conversion factors used
| Fuel | Net Calorific value (TJ/Gg) | CO2 emission for combustion (kg/TJ) |
|---|---|---|
| Coking Coal | 28.2 | 94600 |
| Crude Oil | 42.3 | 73300 |
| Natural Gas Liquids | 44.2 | 64200 |
| Natural Gas | 48.0 | 56100 |
*The net calorific values and CO2 emission for combustion are as per IPCC (2006) Guidelines for National Greenhouse Gas Inventories Tables 1.2 and 1.4.
Table. 3 Sources reference list
| Acronym | Full Name | Link |
|---|---|---|
| DEE | Department of Environment and Energy (2018) | https://www.energy.gov.au/publications/australian-energy-update-2018 |
| OCE | Office of the Chief Economist | https://publications.industry.gov.au/publications/ resourcesandenergyquarterlyjune2019/index.html |
| OECD Gas | Organisation for Economic Cooperation and Development iLibrary (2018) | https://www.oecd-ilibrary.org/energy/data/iea-natural-gas-information-statistics_naturgas-data-en doi: 10.1787/naturgas-data-en |
| IPCC | International Panel for Climate Change (2006) | https://www.ipcc-nggip.iges.or.jp/public/2006gl/vol2.html |
References
Department of Environment and Energy (2018). Australian Energy Statistics (Table J and Table N).
https://www.energy.gov.au/publications/australian-energy-update-2018
Office of the Chief Economist (2019). Quaterly – Historical Data June 2019
https://publications.industry.gov.au/publications/resourcesandenergyquarterlyjune2019/index.html
International Energy Association (2018). Natural gas imports by origin, doi: 10.1787/naturgas-data-en
https://www.oecd-ilibrary.org/energy/data/iea-natural-gas-information-statistics_naturgas-data-en
OECD
https://www.oecd-ilibrary.org/